
This activity involved retrieving data from open sources such as Open Data Canada and the City of Vancouver, reclassifying Digital Elevation Model files (DEMs) and creating buffer zones around areas of low elevation.
This resulted in two overview maps of all areas in Metro Vancouver with potential storm surge flooding based on elevation, a map of potential flooding based on a 1 km shoreline buffer, a map of all roads affected by potential flooding, and finally a map of the False Creek Tidal Flats in fine resolution showing schools and the new St. Paul’s hospital location that could be affected by potential flooding.
It was important to note that was potential for sources of error in my analysis. These may include but are not limited to any DEM data collection errors which would result in inaccurate map sheets or errors regarding shoreline buffer zones, as this does not take into account previous mitigation efforts by the City of Vancouver (i.e, dikes, seawallsetc,...)
Maps Created:
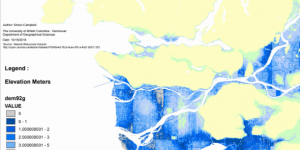
City of Vancouver: Areas of Low Elevation
City of Vancouver: Map of Potential Flooding
City of Vancouver: Roads Affected by Potential Flooding
False Creek Tidal Flats Area Detail Map
This activity helped me to gain a practical working knowledge of ArcGIS and how to use DEM datasets in the context of natural hazards.