
This activity involved accessing and downloading Canadian census data: both spatial maps files for CTs and DAs; and tabular data files for CTs and DAs, for 2 different time frames – 2011 and 2016 census data.
- Quantitative Data Classification
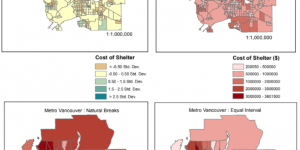
Working with Census data required me to use different data classification methods, as a way of visually representing the data in different ways, for different reasons. It is evident from these four maps that different methods of data classification influence the interpretation of data. For example, certain areas show different values for each classification method, such as by comparing 'standard deviation' with 'natural breaks' we see a very different map. See lab4dataclass
- Data Uncertainty
Looking at these census maps, we can see that some areas have no data, or display a value of zero. This may be caused by areas not being evaluated the same way due to small population sizes (i.e, indigenous treaty land), or there may not be data available for the census. 4.1% of Metro Vancouver CT's are represented by 0's, and 3.7% of DAs. Although this is a small portion, zero values will skew the data set when classifying by standard deviation or determining the mean average cost of housing. This presents a degree of uncertainty in my analysis, which can be mitigated by placing greater value on DA census data, since population sizes are smaller, and therefore the data collected for an area is likely to be more accurate.
- Housing affordability
The maps I created that compare shelter cost in 2011 with 2016, show the general increase in property value in Metro Vancouver over that time period. It is evident that certain areas in Vancouver have increased dramatically,(lie within the >3million class), while others have remained somewhat consistent. However, it should be noted that these maps are only taking into account shelter cost, which is referred to as "the average monthly total of all shelter expenses paid by households that own or rent their dwelling" by the Canadian Census of Population Dictionary. This does NOT take into account the cost of housing relative to inflation, or mean annual income per household. These factors should be considered when looking at this census data in terms of housing affordability. See Cost of Housing 2011-2016
Evaluated the integrity of geospatial data to identify potential biases in data classification methods, and used these insights to identify the strengths and weaknesses in visually representing census data.